| . | |||||||
| [poll archive] [home] | |||||||||||||||||||||||||||||||||||||||||||||||||||||||||||||||||||||||||||||||||||||||||||||||||||||||||||||||||||||||||||||||||||||||||||||||||||||||||||||||||||||||||||||||||||||||||||||||||||||||||||||||||||||||||||||||||||||||||||||||||||||||||||||||||||||||||||||||||||||||||||||||||||||||||||||||||||||||||||||||||||||||||||||||||||||||||||||||||||||||||||||||||||||||||||||||||||||||||||||||||||||||||||
|
Ciruli Associates Poll Presidential Race Deadlocked in Colorado Prior to Debate; Analysis by Floyd Ciruli In the latest Ciruli Associates statewide voter poll, conducted just prior to the September 26 presidential debate, the race in Colorado was deadlocked at 44 percent for Senator Barack Obama and 43 percent for Senator John McCain.
Ciruli Associates, N501, 2008 Question: First, let me ask you about the presidential election. If you had to vote today, would you vote for John McCain and Sarah Palin, the Republicans; Barack Obama and Joe Biden, the Democrats; or some other candidate? [Reverse order of names] A 2-point McCain lead in Colorado after the Republican National Convention has dissipated, and now Obama is up in Colorado polls. In recent Colorado polls, Obama is leading by 1 to 4 percentage points.
The Third-Annual Citizens Poll (Sept. 19-23, 2008) was sponsored by the Economic Development Council of Colorado (EDCC), a statewide consortium of local and regional economic development professionals. The statewide survey was conducted with 501 Colorado voters, and has a statistical range of error of ±4.4 percentage points. . . . . . . . . . . . . . . . . . .Senate Election Mark Udall has a seven-point lead in the U.S. Senate race over Bob Schaffer, 45 percent to 38 percent.
Ciruli Associates, N501, 2008 Question: Let me ask you about the U.S. Senate race here in Colorado. If you had to vote today for U.S. Senator, would you vote for Mark Udall, the Democrat, or Bob Schaffer, the Republican? [Reverse order of names] Recent polls have shown a Udall lead of 2 to 8 percent.
Favorability ratings of the two candidates show that Udall has a 49 percent favorable and 33 percent unfavorable score whereas Schaffer is 10 points lower with a 39 percent favorable and a 38 percent unfavorable. (Nearly one-quarter of voters (24%) could not rate Schaffer and 17 percent couldn’t rate Udall.)
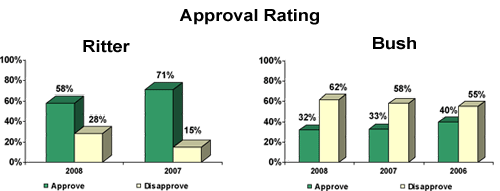
Approval Ratings: Ritter and Bush Although Governor Bill Ritter’s approval has dropped since it was first tested in 2007, it is still in the high fifties (58%), and near Governor Bill Owens’ approval rating of 60 percent in September 2006 at the end of his term. President George W. Bush’s approval continues to decline. 
Ciruli Associates, N501, 2008 Question: Thinking about Colorado Governor Ritter’s job performance, do you approve or disapprove of the way Bill Ritter is handling his job as governor? Question: Next, let me ask about the president’s job performance. Do you approve or disapprove of the way George W. Bush is doing his job as president? In a generic ballot test asking voters if they intend to vote for a Democratic candidate for Congress or a Republican candidate, the Democrats won 42 percent to 39 percent, a modest, but still significant advantage.
Research Design The 501 respondents of the telephone survey were selected from a random sample of Colorado registered voters who regularly vote in presidential-year elections. Voters were then screened to determine their likelihood to vote. This is the third-annual survey for the EDCC on economic development and government issues. Statistical range of accuracy in 19 out of 20 cases is plus or minus 4.4 percentage points for a sample size of 501 – meaning that 95 percent of the time if all voters with telephones in Colorado had been surveyed, the findings would differ from the survey results by no more than plus or minus 4.4 percentage points. Survey results can be affected by other factors, such as question wording and order.
. . . . . . . . . . . . Ciruli Associates is an independent, non-partisan research firm providing polling, election analysis and political commentary to Colorado and national media organizations since 1976. |
|||||||||||||||||||||||||||||||||||||||||||||||||||||||||||||||||||||||||||||||||||||||||||||||||||||||||||||||||||||||||||||||||||||||||||||||||||||||||||||||||||||||||||||||||||||||||||||||||||||||||||||||||||||||||||||||||||||||||||||||||||||||||||||||||||||||||||||||||||||||||||||||||||||||||||||||||||||||||||||||||||||||||||||||||||||||||||||||||||||||||||||||||||||||||||||||||||||||||||||||||||||||||||